During his extensive research on the topic of site specific climate data and Passive House, John Morehead discovered that the currently available climate data was inaccurate and could potentially have a significant impact on the actual performance of Passive Houses in Ireland.
In September, 2010, John was invited to make a presentation at the SEAI ‘See The Light – Building A Carbon-Free Future’ conference at Croke Park on the ‘Impact of climate variation in Ireland on the performance of passive and low energy projects’. To read the paper presented click HERE.
In 2012 ‘See The Light’ conference, the lack of localised (site specific) climate data was highlighted as a significant inaccuracy and cautioned against the use of DEAP as a design rather than compliance tool.
Our research in 2010 identified the optimal glass specification and particularly the g-value for low energy buildings was heavily influenced by local climate conditions.
In order that site specific climate data can be generated to a specific standard, Wain Morehead Architects Limited, using Meteonorm, has agreed a methodology for generating site specific climate data suitable for the design and certification of Low Energy Buildings with the PHI (Passive House Institute) and are now regularly commissioned to produce location-specific climate data for the Passive House industry.
Ireland and those who use WUFI software as both are critically influenced by local climate conditions in many parts of Europe, the Americas and Austral Asia. Climate data used for WUFI and PHPP calculations in our offices have identified a 50% variation in energy performance in different regions in Ireland for one particular Passive House design. As a result, many of the Irish Passive houses have today used WMA climate data for honing their performance.
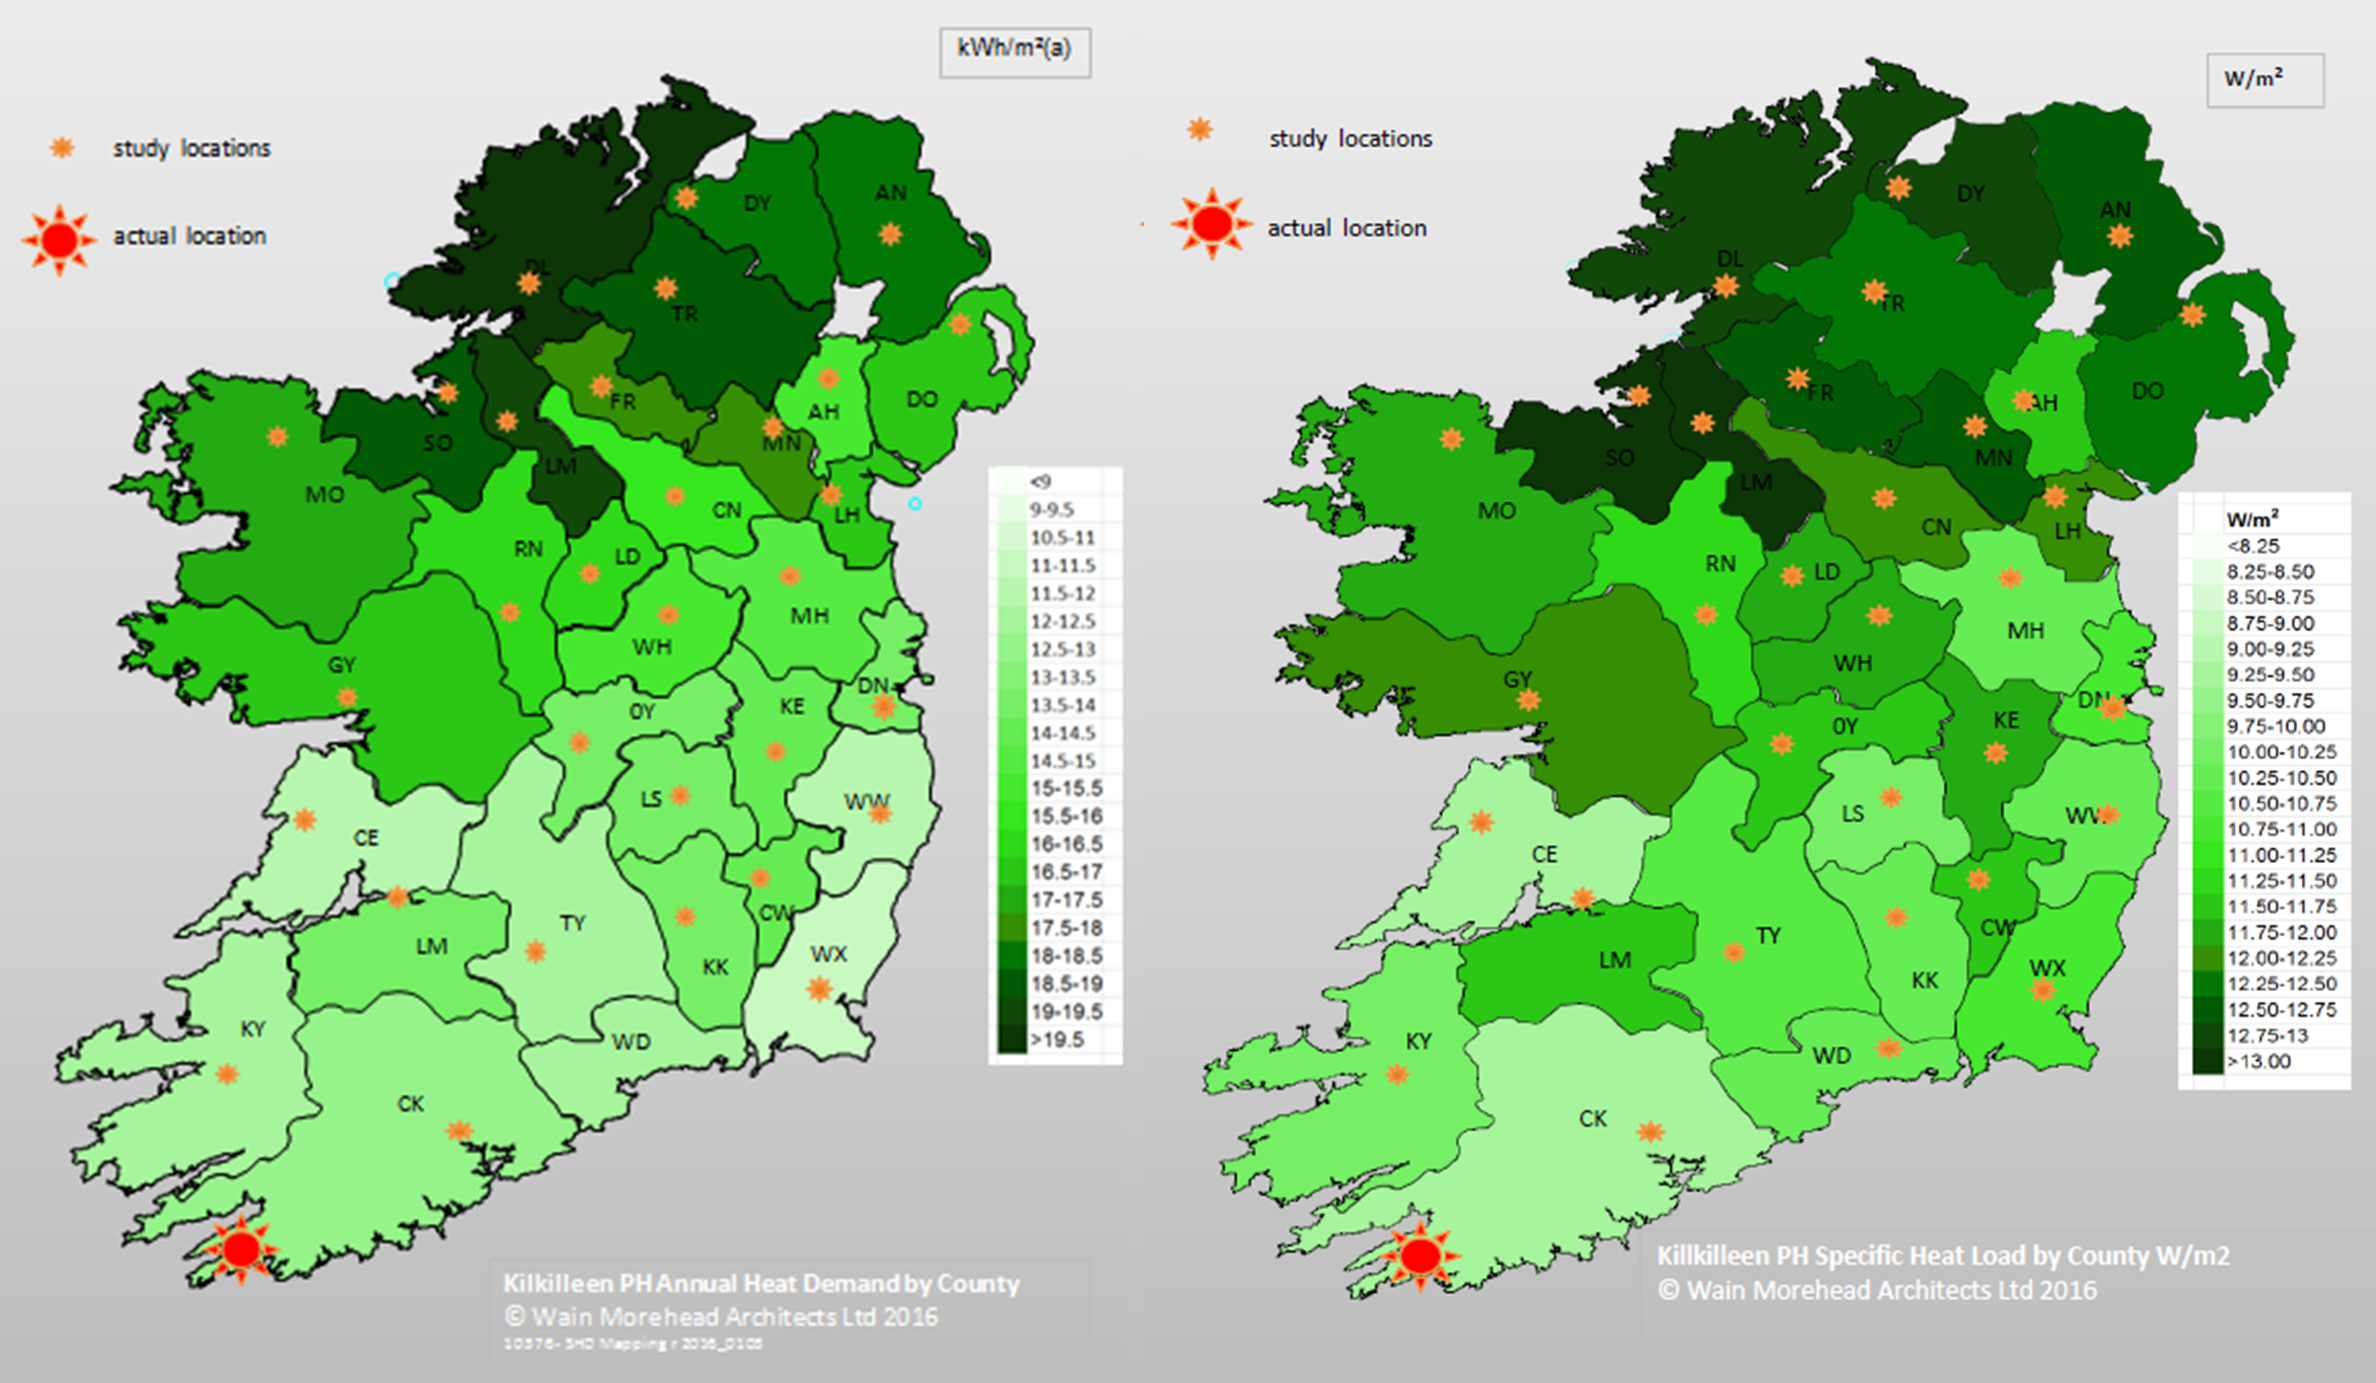
As an illustration of the impact that climate can have on energy performance of a building the above diagrams show the variation in energy performance of a house, designed for South West Cork, if it were positioned in various locations around Ireland. It shows a variation in Specific Heat load of circa 50% and Specific Heat demand of circa 100% depending on its location in Ireland.

Graphic illustrating the impact site specific climate data can have on the energy performance of a dwelling if it were positioned in various locations around Ireland

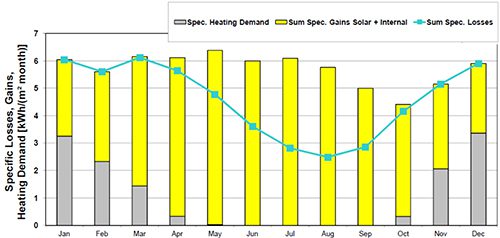
Heating Demand Based on Site Specific Climate Data


